

In today's digital world, monitoring systems are crucial for maintaining the stability of applications and infrastructure. This article will introduce how to use Grafana and CnosDB to build a robust monitoring system for real-time performance, issue discovery, and taking timely actions.
Grafana: Open-Source Monitoring and Dashboard Tool
Grafana is a popular open-source monitoring and dashboard tool that offers rich data visualization capabilities and an easy-to-use dashboard editor. In Grafana, you can create various types of charts, including line charts, bar charts, and dashboards, to display your monitoring data.
CnosDB: High-Performance Time Series Database
CnosDB is a high-performance, distributed time series database with outstanding horizontal scalability and availability. It is suitable for various scenarios, including large-scale time series data storage and analysis.
Step 1: Installing CnosDB
|For more deployment options, please refer to: https://docs.cnosdb.com/zh/latest/deploy/install.html
- Install and start CnosDB.
docker run --name cnosdb -p 8902:8902 -d cnosdb/cnosdb:community-latest cnosdb run -M singleton- Create a databaseUsed for storing monitoring data.
curl -i -u "root:" -XPOST "http://localhost:8902/api/v1/sql" -d 'CREATE DATABASE node_metrics'Step 2: Collect Host Data
| Please follow these instructions for Mac environment, for other operating systems, please refer to: https://docs.influxdata.com/telegraf/latest/install/
- Download Telegraf.
brew update
brew install telegraf- Modify the metric collection configuration as follows.
| vim /opt/homebrew/etc/telegraf.conf
[global_tags]
[agent]
  interval = "10s"
  round_interval = true
  metric_batch_size = 1000
  metric_buffer_limit = 10000
  collection_jitter = "0s"
  flush_interval = "1s"
  flush_jitter = "0s"
  precision = "0s"
  hostname = ""
  omit_hostname = false
[[outputs.http]]
  url = "http://127.0.0.1:8902/api/v1/write?db=node_metrics"
  timeout = "5s"
  method = "POST"
  username = "root"
  password = ""
  data_format = "influx"
  use_batch_format = true
  content_encoding = "identity"
  idle_conn_timeout = 10
[[inputs.cpu]]
  percpu = true
  totalcpu = true
  collect_cpu_time = false
  report_active = false
  core_tags = false
[[inputs.disk]]
  ignore_fs = ["tmpfs", "devtmpfs", "devfs", "iso9660", "overlay", "aufs", "squashfs"]
[[inputs.diskio]]
[[inputs.kernel]]
[[inputs.mem]]
[[inputs.processes]]
[[inputs.swap]]
[[inputs.system]]
[[inputs.net]]- Start the Telegraf data collection tool.
brew services start telegrafStep 3: Install Grafana
For deployment options, please refer to: https://grafana.com/docs/grafana/latest/
docker run --name grafana -p 3000:3000 -d grafana/grafana:9.3.6Step 4: Configure the CnosDB Data Source
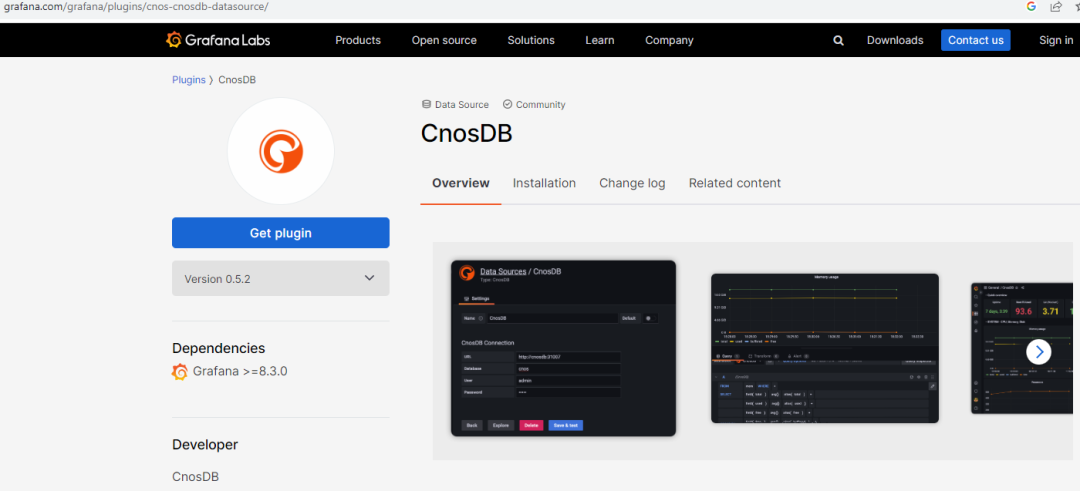
| Grafana supports a native connection plugin for CnosDB.
- Install the CnosDB data source plugin.
docker exec grafana /bin/sh grafana-cli plugins install cnos-cnosdb-datasource After installing the plugin, you will need to restart for it to take effect.
docker restart grafana- To add a CnosDB data source connection in Grafana, follow these steps:
- Log in to the Grafana web interface: http://127.0.0.1:3000.
- Navigate to “Configuration” > “Data Sources.”
- Click the “Add data source” button.
- In the data source type, select “CnosDB.”
- Fill in the CnosDB connection information in the configuration, including the host, port, username, and password.
- Click the “Save & Test” button to test if the connection is successful.
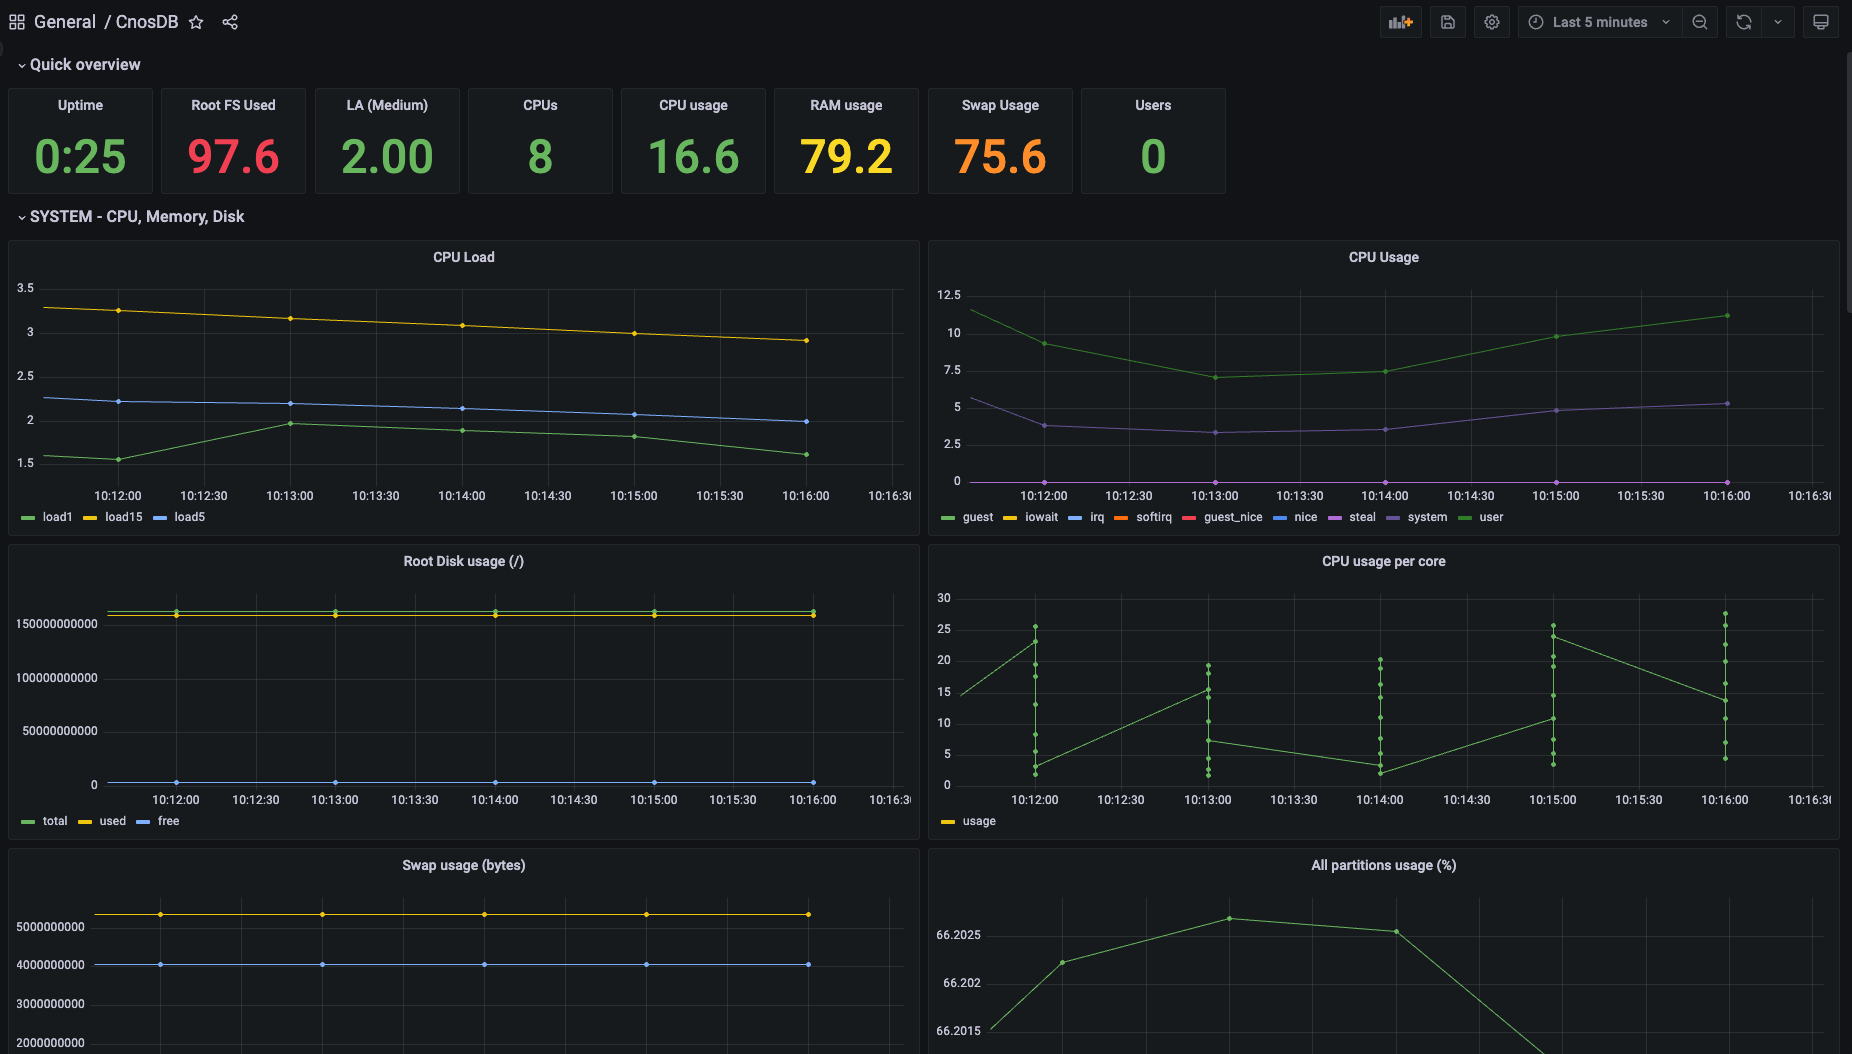
Step 5:Import Dashboard
To add a dashboard for visualizing host performance, follow these steps:
- Navigate to “Dashboards.”
- Click on “New” > “Import.”
- Copy the JSON file [https://github.com/cnosdb/docs/blob/main/assets/grafana_dashboard.json] into “Import via panel JSON.”
- Click the “Load” button.
- Select the data source you set up earlier and click “Import.”
- After successful import, you will see the charts.
Step 6:Set Up Alert Rules
Monitoring systems are not only for visualizing data but also for alerts. You can set up alert rules to notify your team under specific conditions. Here are the steps to set up alert rules in Grafana:
- In dashboard edit mode, select the chart you want to set up alerts for.
- Click the “Edit” button in the upper right corner of the chart.
- In the “Alert” tab, configure alert rules, including trigger conditions and notification methods (e.g., email notifications, Slack notifications, etc.).
- Click the “Apply” button to save the alert rules.
Conclusion
Deploying and maintaining a monitoring system is an ongoing process. Ensure that you regularly update Grafana and CnosDB and adjust dashboards and alert rules as needed. Also, periodically review data retention policies to prevent excessive storage usage.
By using Grafana and CnosDB, you can build an efficient monitoring system to help you monitor and analyze the performance of your applications and infrastructure in real-time. With proper configuration and maintenance, you can quickly detect issues and take action to ensure system stability and reliability. We hope this article helps you get started with building your monitoring system to improve system availability and performance.